
Business decision-making has been revolutionized by Google Analytics. Having access to a variety of data e-commerce store owners have the ability to make informed decisions and adapt to changing trends quickly.
What many online businesses don’t realize is that they can get a deeper understanding of their shoppers using Enhanced E-commerce tracking in Google Analytics. While it is a bit complicated to get started with, it provides you with more data in report form like Shopping Behaviour analysis, Product List Performance, Internal Promotions, Order Coupon, among others which tell you how your store’s revenue is being impacted. It is recommended to take the help of an implementation expert to get enhanced e-commerce configured for your store.
Some tips to remember when setting up enhanced e-commerce is that setting up enhanced e-commerce for a different property than the one you have standard e-commerce tracking so that you don’t have the codes interfering with each other. You can do this by creating two separate trackers like the ones below so that the data is captured in both properties:
- ga('create', 'UA-XXXXX-Y', 'auto');
- ga('create', 'UA-XXXXX-Z', 'auto', 'clientTracker')
Make sure that one of them has the name “tracker” and commands are prefixed with “name.” eg. of above, the code will be ga('clientTracker.send', 'pageview').
Let's take a look at the reports you can see once you have enhanced e-commerce tracking set up for your e-commerce store.
Overview of Reports in Enhanced E-commerce
You can find these reports in the Conversion > E-commerce section of Google Analytics and can be divided into:
1. Revenue Reports
- a. Shopping Behaviour
- b. Checkout Behaviour
- c. Product Performance
- d. Sales Performance
- e. Product List Performance
2. Marketing Reports
- a. Internal Promotion
- b. Order Coupon
- c. Product Coupon
- d. Affiliate Code
While you may see some reports are common with standard e-commerce tracking, the difference comes in what data is being recorded by enhanced e-commerce. Standard e-commerce tracking will only be able to map the customer journey once they have added an item to their cart and are in the process of checking out. With enhanced e-commerce tracking, you will be able to map user journeys all over your store. This is instrumental in creating your sales funnel and seeing where users are dropping off. Enhanced e-commerce also gives you more information about transactions as standard e-commerce does not track repeat transactions.
Revenue Reports
Shopping Behaviour
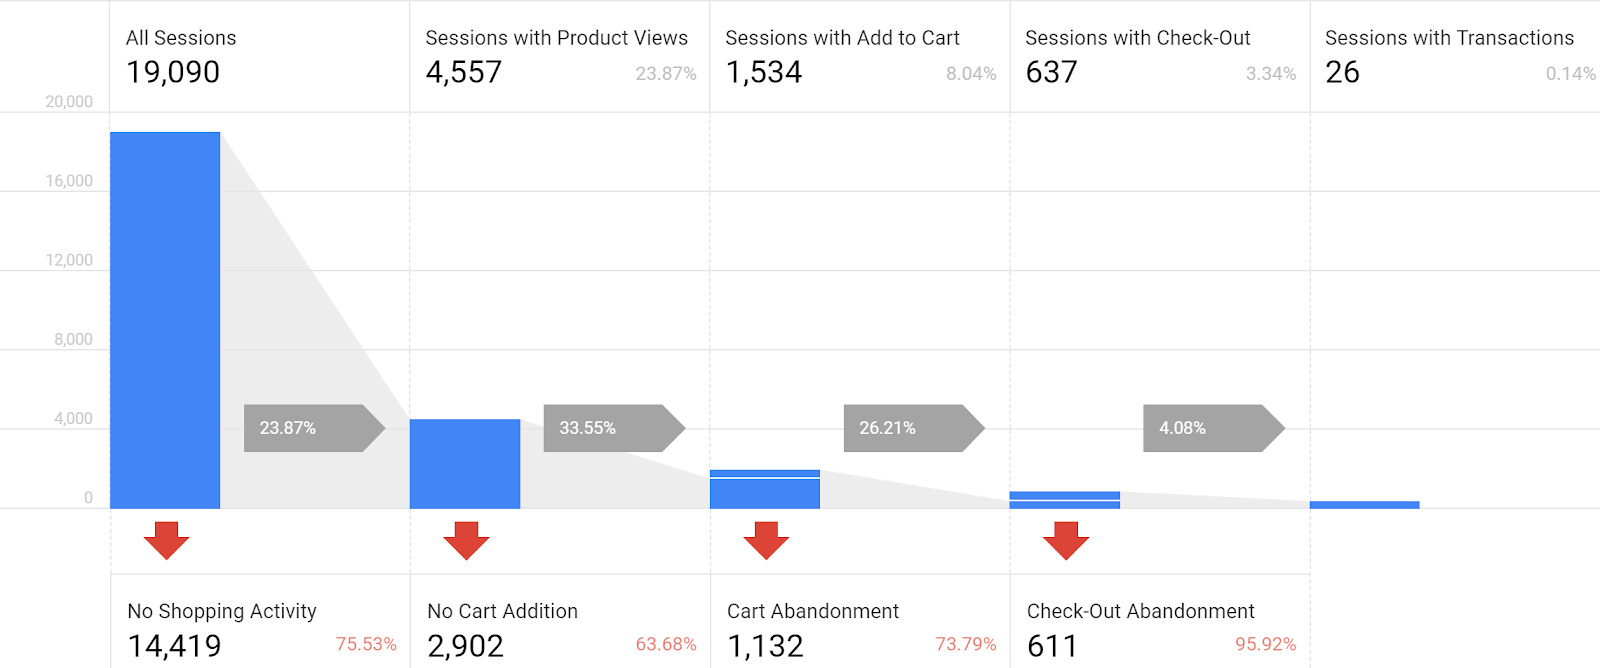
The Shopping Behaviour report shows how your customers have progressed from one stage of your sales funnel to the next. It tracks the users through 5 stages:
- All Sessions - When people visit your e-commerce store.
- Sessions with Product Views - When visitors open product pages after interacting with the search bar or some other navigation.
- Sessions with Add to Cart - When users add products to their shopping carts.
- Sessions with Check-out - When users are ready to complete the transaction on your site.
- Sessions With Transactions - When users complete the transaction on your website.
The red arrows dropping down are the abandonment that happened at each stage of this process. What makes this and Checkout behaviour report special is that you can click on any one of the bars or arrows to make that a custom segment so you can deep dive and understand these customers better.
You can use the data table below this chart to apply different dimensions like devices, regions, campaigns, etc. to your sessions and abandonment data to get the data in an exportable report.
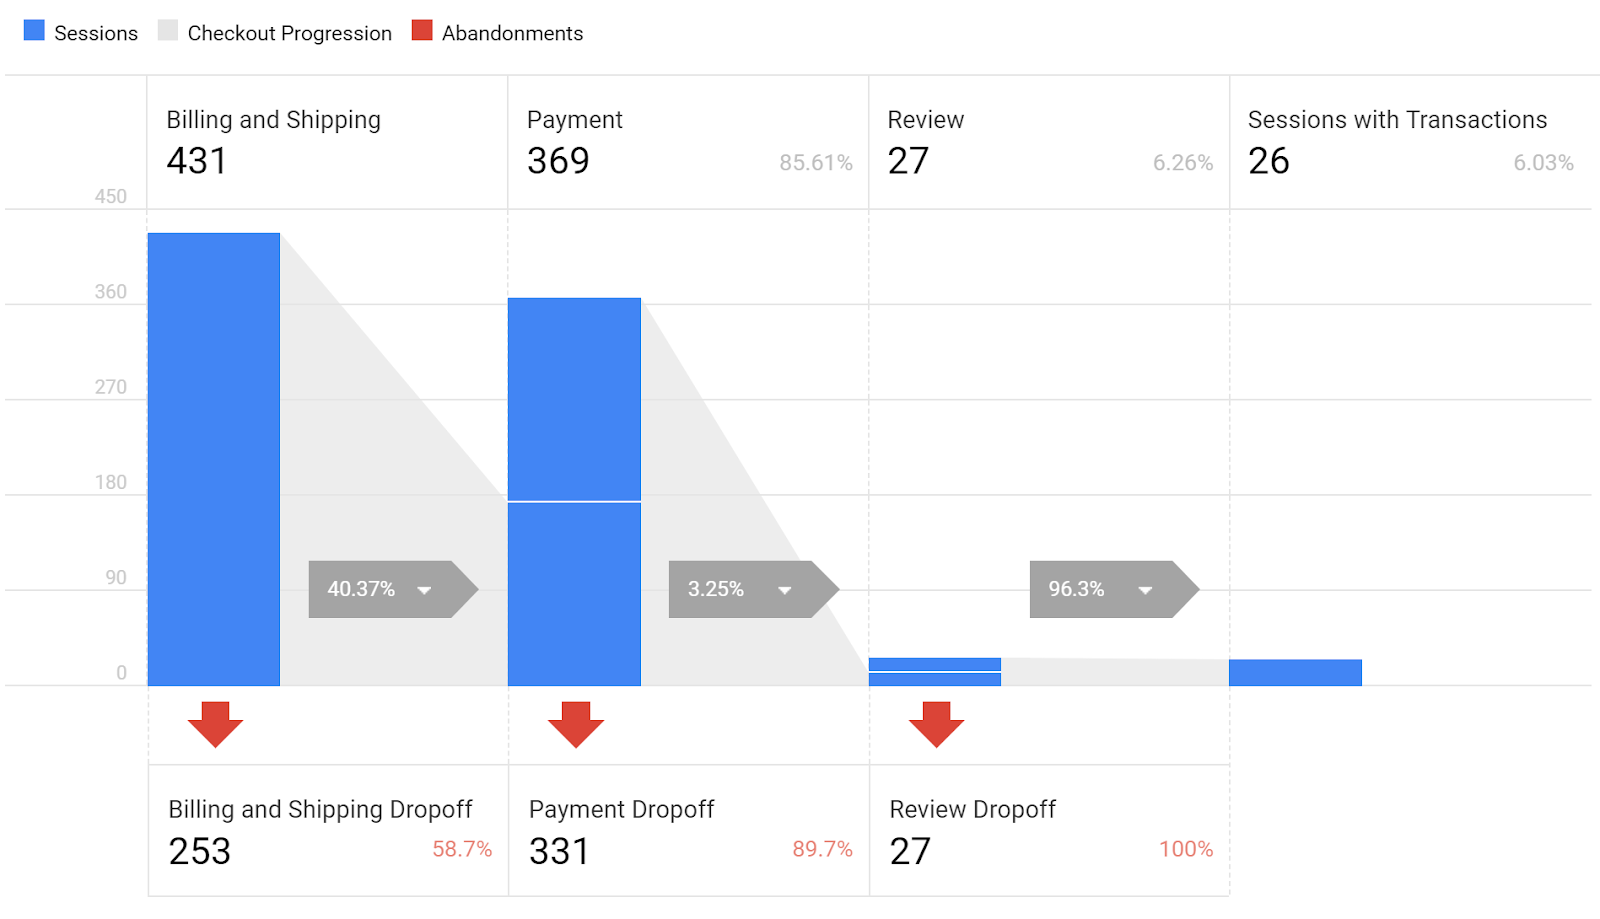
Checkout Behaviour
The layout of the checkout report is similar to the behaviour report but it maps out when users enter or exit your site’s checkout process. You can customize the names or add steps involved to suit your business. You can access these settings in E-commerce Settings > Enable Enhanced E-commerce Reporting under the Checkout Labeling menu.
The reports you generate with checkout behaviour is valuable to understand where users are abandoning the checkout process in your store and what could be the reason behind it.
Product Performance
Product Performance reports help you look at the revenue contribution of the different product lines you offer. You can track sales performance across dimensions like Products, Product SKUs, Product Category or Product Brands.

With the table given, you can track how these products have impacted your bottom line and how well are they selling.
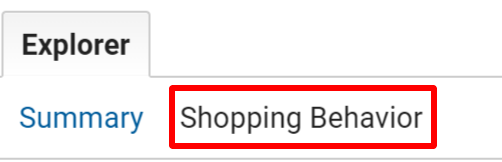
Clicking on Shopping behaviour can track above the chart can tell you other information regarding the checkout process like how many times a product was added to or removed from a cart. This report focuses on how users behave on your e-commerce site.

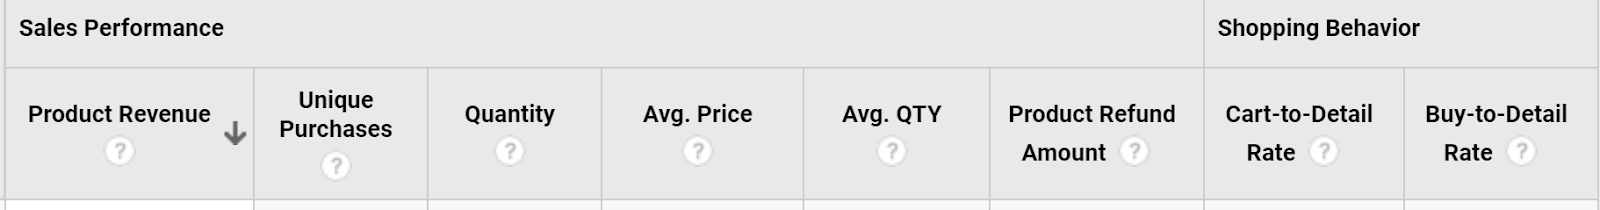
Cart-to-Detail and Buy-to-Detail rates are some new metrics introduced by this report. They indicate how many users took the respective action compared to the total number of people who clicked through to the product to see detailed information about it. You can use these reports to gauge how interesting your product descriptions and pictures are that they prompt users to take an action.
Sales Performance
The Sales Performance report can help you break down what sales are being generated per order and how much of it goes to taxes, shipping, or gets refunded. It also gives you the number of items sold.

Product List Performance
The Product List Performance report groups products together based on how they appear on your site. Typically a user would see products as a part of:
- Category pages
- Search results
- Cross-sell or Up-sell blocks
- Related products
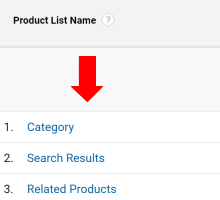
By clicking through to these, you can see how users interacted with products and how did they affect store revenues.

Marketing Reports
These reports can be found in Conversions > E-commerce > Marketing
Internal Promotion
Internal promotion reports let you check which campaigns have been most effective in driving traffic to products promoted by on-site banners and ads. The promotions are divided as per the names that were given to them. You can track views or impressions and the clicks it received and how many of them went on to convert.

One thing to note is that Google Analytics assigns the credit to the last promotion clicked before conversion whether or not it was applicable.
Order Coupon
This report tells you how many times which order code has been used and their impact on sales. You should be able to tell which codes are driving transactions and if they are having a positive impact as on revenue as well.

Product Coupon
This report tells you which products codes are being used and their effect on your sales. The layout is similar to Order Coupon report only this gives you details about reports and how they are driving traffic and revenue.

Affiliate Code
This report provides valuable information if you are using affiliate marketing to promote your store. It tells you which sources are generating revenue for your store.

How you can use enhanced e-commerce reports to make better decisions
You need to be able to derive actionable insights from enhanced e-commerce tracking to increase your e-commerce business’ conversion and traffic. While the requirements of every business are different, here are some questions to start you off:
1. Which products or categories are contributing the most to your revenue?
The answer can be found in the Product Performance report. Here you can sort by Product Revenue and see which products are selling well. By changing the dimension from products to product categories, you will be able to get this information for categories as well. This data can also tell you how many purchases have been made of these items and how many of them were unique.
2. What are sessions with add to cart doing differently from the rest?
By looking at Shopping Behaviour reports you can create a segment with all Sessions that had “add to cart” and you can then apply this segment to Behaviour or Audience reports to get a deeper understanding of this audience. With this data, you will be able to create more targeted marketing campaigns.
3. Which products were removed from carts frequently?
This can be seen in the Product Performance reports as well. First, click on the Shopping Behavior button on top of the graph. This will give you a list of products that are being removed from carts frequently.
4. What products are being searched for and what is their contribution to revenue?
You can see a list of products that appear when a customer engages with your e-commerce search by going to the Product List Performance report and selecting Search Results as the list name. This will show you the number of times a particular product appears as a result and how many times people clicked through to see the details page. It will also give you information regarding its revenue.
5. What is a particular product’s contribution to total revenues?
By going into the Product Performance reports you can see how much revenue products are generating. Then you need to click on the percentage or performance tab next to the search bar.

This will give a visual representation of revenue contribution. You will also be able to change the metric from revenue to refunds, Quantity, Purchases, among others.
6. Where are users abandoning the checkout process?
By going to the Checkout Behaviour you can see where users dropped off in the checkout process. Then by clicking on the Abandonments tab above the table, you can see which users were abandoning checkout and you can further refine this dimension by geography, new or returning users, devices, sources, etc. by clicking on the drop-down menu. Use this data to see what hurdles are causing people to not complete their transactions.
7. What is the sequence of steps taken by an average buyer?
The map out your user’s purchase journey, you need to first create a segment of visitors who successfully completed a transaction on your website. Going to Shopping Behaviour report, click on the very last bar to instantly make those sessions that completed a transaction as the custom segment. Select which view you want to the segment to be accessible. Then you can go to any analytics report in the Audience, Behaviour or Conversions tab to get more details about where these users come from and how they interact with your site.
8. How can Cart-to-Detail or Buy-to-Detail tell me more about my customers?
To see these reports you will need to go to Product Performance reports and then click on Shopping Behaviour tab above the graph. Both these metrics are used to gauge how interesting your product images and product descriptions are in attracting shoppers. If a user already has their mind set on buying something, they typically just add products to cart from the search results page. People who are browsing will be clicking through to get a better understanding of the product and your descriptions have to take on the role of the salesperson trying to convince them to make the purchase. High-quality images and descriptions are very important for this reason.
9. How have banner ads impacted sales and conversions?
You will first have to create Tags using Google Tag Manager to measure impression or views and clicks. Then going to the Internal Promotion reports will tell you how they impacted conversions. The report attributes transactions based on either a promotion view or promotion click through. One thing to note is that if a transaction occurs then the last internal promotion view or click even if they may not have been relevant to the purchase.
10. How effective have the promotional discounts been?
You can gauge the impact of promotions on products by looking at both Order Coupon and Product Coupon reports. This is a great way to compare how a particular sale or offer affected different product categories. You can also check if a product’s conversions rates where any different from when there were no discounts to see how revenue is being influenced by these promotions.
Conclusions
Enhanced e-commerce is a great resource for understanding how your online business can keep growing. The reliable data from enhanced e-commerce tracking will improve your decision-making capability so you can increase sales and revenue for your store. A good starting point when looking at enhanced e-commerce data is first concentrating on optimizing the checkout process, then moving on to search or product related insights.
We also recommend focusing on search analytics to gain an additional layer of insight into your customer’s purchase journey. You can create a segment of the close to 30% of visitors interacting with search as soon as they land on your website. This data forms the basis of many key strategies by setting up search-specific events and goals.
SearchTap.io has helped many e-commerce stores improve their site search but also increase search conversions by 30-40%. You can learn more by booking a personalized demo with us or emailing us at hello@searchtap.io.

Hi there! Want to ask about something? Leave a message.